Изменение оси X seqlogo фигурирует в MATLAB
Я делаю большое количество seqlogos программно. Они - сотни широких столбцов и настолько рабочий a seqlogo обычно создает буквы, которые являются слишком тонкими для наблюдения. Я заметил, что только забочусь о нескольких из этих столбцов (не обязательно последовательные столбцы)... большинство - шум, но некоторые высоко сохраняются.
Я использую что-то вроде этого отрывок:
wide_seqs = cell2mat(arrayfun(@randseq, repmat(200, [500 1]), 'uniformoutput', false));
wide_seqs(:, [17,30, 55,70,130]) = repmat(['ATCGG'], [500 1])

conserve_cell = seqlogo(wide_seqs, 'displaylogo', false);
high_bit_cols = any(conserve_cell{2}>1.0,1);
[~, handle] = seqlogo(wide_seqs(:,high_bit_cols ));
Хотя, когда я делаю это, я теряю информацию, о котором столбцах данные прибыли из.
Обычно я просто изменил бы ось X seqlogo. Однако seqlogoсвоего рода сумасшедший основанный на Java объект и вызовы как:
set(handle, 'xticklabel', num2str(find(high_bit_cols)))
не работать. Любая справка значительно ценилась бы.
Спасибо, будет
Править:
На щедрости я готов признать, что любой вид сумасшедшего метода для изменения подписей оси включает (но не ограниченный): Используя панель инструментов обработки изображений для изменения изображения после сохранения, создания новой функции seqlogo использование текстовых полей, изменение кода Java (если возможный), и т.д. Я не готов принять вещи как "Python использования", "пользуются этой библиотекой R" или любым другим видом non-Matlab решения.
5 ответов
ОК, я убил несколько часов на эту проблему. Оказывается, вы не можете поместить какой-либо объект MATLAB (оси или текстовое поле) поверх этого объекта hgjavacomponent. И, конечно же, я не смог модифицировать java-код. Поэтому единственное приемлемое решение, которое я нашел, - это создать фигуру с нуля.
Я не хотел переписывать код для вычисления матриц веса (высоты символов), вы это уже сделали. Но это можно сделать, если вы вообще не хотите использовать seqlogo в MATLAB. Поэтому я немного изменил вашу последнюю строку, чтобы получить матрицу:
[wm, handle] = seqlogo(wide_seqs(:,high_bit_cols ));
Проблема с текстовыми символами в том, что вы не можете точно контролировать их размер, не можете подогнать символ под текстовое поле. Возможно, именно поэтому MATLAB решил использовать графический объект java. Но мы можем создавать изображения символов и работать с ними.
Вот код для создания изображений букв:
letters = wm{1};
clr = [0 1 0; 0 0 1; 1 0.8 0;1 0 0]; % corresponding colors
for t = 1:numel(letters)
    hf = figure('position',[200 200 100 110],'color','w');
    ha = axes('parent',hf, 'visible','off','position',[0 0 1 1]);
    ht = text(50,55,letters(t),'color',clr(t,:),'units','pixels',...
        'fontsize',100,'fontweight','norm',...
        'vertical','mid','horizontal','center');
    F = getframe(hf); % rasterize the letter
    img = F.cdata;
    m = any(img < 255,3); % convert to binary image
    m(any(m,2),any(m,1))=1; % mask to cut white borders
    imwrite(reshape(img(repmat(m,[1 1 3])),[sum(any(m,2)) sum(any(m,1)) 3]),...
        [letters(t) '.png'])
    close(hf)
end
Затем мы используем эти изображения для построения нового графика seqlogo:
xlabels = cellstr(num2str(find(high_bit_cols)'));
letters = wm{1};
wmat=wm{2}; % weight matrix from seqlogo
[nletters  npos] = size(wmat);
wmat(wmat<0) = 0; % cut negative values

% prepare the figure
clf
hAx = axes('parent',gcf,'visible','on');
set(hAx,'XLim',[0.5 npos+0.5],'XTick',1:npos,'XTickLabel',xlabels)
ymax = ceil(max(sum(wmat)));
ylim([0 ymax])
axpos = get(hAx,'Position');
step = axpos(3)/npos;

% place images of letters
for i=1:npos
    [wms idx] = sort(wmat(:,i)); % largest on the top
    let_show = letters(idx);
    ybot = axpos(2);
    for s=1:nletters
        if wms(s)==0, continue, end;
        axes('position',[axpos(1) ybot step wms(s)/ymax*axpos(4)])
        ybot = ybot + wms(s)/ymax*axpos(4);
        img = imread([let_show(s) '.png']);
        image(img)
        set(gca,'visible','off')
    end
    axpos(1)=axpos(1)+step;
end
Вот результат: alt text http://img716.imageshack.us/img716/2073/seqlogoexample.png
Код и рисунок, конечно, можно усовершенствовать, но я надеюсь, что это то, с чем вы можете начать работать. Дайте мне знать, если я что-то упустил.
Что касается оси x, кажется, что фигура содержит нет стандартной оси ( findobj (handle, 'type', 'axes') пусто), скорее пользовательский объект класса com.mathworks.toolbox.bioinfo.sequence.SequenceLogo . ..
На несвязанном примечании вы можете заменить свою первую строку более простым вызовом:
wide_seqs = reshape(randseq(200*500),[],200);
Если оси являются java-объектом, вы можете посмотреть его методы и свойства с помощью uiinspect . Это может дать вам представление о том, что вам следует отредактировать, чтобы добиться желаемого поведения (к сожалению, у меня нет набора инструментов, поэтому я не могу найти его для вас).
Я столкнулся с теми же проблемами Юк пытался изменить рисунок из SEQLOGO , поэтому вот моя попытка в моей версии, чтобы имитировать его внешний вид. Это функция seqlogo_new.m , которой вы указываете два аргумента: вашу последовательность и необязательное минимальное значение битов. Для этого требуется файл изображения ACGT.jpg , который можно найти по этой ссылке .
Вот код функции:
function hFigure = seqlogo_new(S,minBits)
%# SEQLOGO_NEW   Displays sequence logos for DNA.
%#   HFIGURE = SEQLOGO_NEW(SEQS,MINBITS) displays the
%#   sequence logo for a set of aligned sequences SEQS,
%#   showing only those columns containing at least one
%#   nucleotide with a minimum bit value MINBITS. The
%#   MINBITS parameter is optional. SEQLOGO_NEW returns
%#   a handle to the rendered figure HFIGURE.
%#
%#   SEQLOGO_NEW calls SEQLOGO to perform some of the
%#   computations, so to use this function you will need
%#   access to the Bioinformatics Toolbox.
%#
%#   See also seqlogo.

%# Author: Ken Eaton
%# Version: MATLAB R2009a
%# Last modified: 3/30/10
%#---------------------------------------------------------

  %# Get the weight matrix from SEQLOGO:

  W = seqlogo(S,'DisplayLogo',false);
  bitValues = W{2};

  %# Select columns with a minimum bit value:

  if nargin > 1
    highBitCols = any(bitValues > minBits,1);  %# Plot only high-bit columns
    bitValues = bitValues(:,highBitCols);
  else
    highBitCols = true(1,size(bitValues,2));   %# Plot all columns
  end

  %# Sort the bit value data:

  [bitValues,charIndex] = sort(bitValues,'descend');  %# Sort the columns
  nSequence = size(bitValues,2);                      %# Number of sequences
  maxBits = ceil(max(bitValues(:)));                  %# Upper plot limit

  %# Break 4-letter image into a 1-by-4 cell array of images:

  imgACGT = imread('ACGT.jpg');                %# Image of 4 letters
  [nRows,nCols,nPages] = size(imgACGT);        %# Raw image size
  letterIndex = round(linspace(1,nCols+1,5));  %# Indices of letter tile edges
  letterImages = {imgACGT(:,letterIndex(1):letterIndex(2)-1,:), ...
                  imgACGT(:,letterIndex(2):letterIndex(3)-1,:), ...
                  imgACGT(:,letterIndex(3):letterIndex(4)-1,:), ...
                  imgACGT(:,letterIndex(4):letterIndex(5)-1,:)};

  %# Create the image texture map:

  blankImage = repmat(uint8(255),[nRows round(nCols/4) 3]);  %# White image
  fullImage = repmat({blankImage},4,2*nSequence-1);  %# Cell array of images
  fullImage(:,1:2:end) = letterImages(charIndex);    %# Add letter images
  fullImage = cat(1,cat(2,fullImage{1,:}),...        %# Collapse cell array
                    cat(2,fullImage{2,:}),...        %#   to one 3-D image
                    cat(2,fullImage{3,:}),...
                    cat(2,fullImage{4,:}));

  %# Initialize coordinates for the texture-mapped surface:

  X = [(1:nSequence)-0.375; (1:nSequence)+0.375];
  X = repmat(X(:)',5,1);     %'# Surface x coordinates
  Y = [zeros(1,nSequence); cumsum(flipud(bitValues))];
  Y = kron(flipud(Y),[1 1]);  %# Surface y coordinates
  Z = zeros(5,2*nSequence);   %# Surface z coordinates

  %# Render the figure:

  figureSize = [602 402];                   %# Figure size
  screenSize = get(0,'ScreenSize');         %# Screen size
  offset = (screenSize(3:4)-figureSize)/2;  %# Offset to center figure
  hFigure = figure('Units','pixels',...
                   'Position',[offset figureSize],...
                   'Color',[1 1 1],...
                   'Name','Sequence Logo',...
                   'NumberTitle','off');
  axes('Parent',hFigure,...
       'Units','pixels',...
       'Position',[60 100 450 245],...
       'FontWeight','bold',...
       'LineWidth',3,...
       'TickDir','out',...
       'XLim',[0.5 nSequence+0.5],...
       'XTick',1:nSequence,...
       'XTickLabel',num2str(find(highBitCols)'),...  %'
       'YLim',[-0.03 maxBits],...
       'YTick',0:maxBits);
  xlabel('Sequence Position');
  ylabel('Bits');
  surface(X,Y,Z,fullImage,...
          'FaceColor','texturemap',...
          'EdgeColor','none');
  view(2);

end
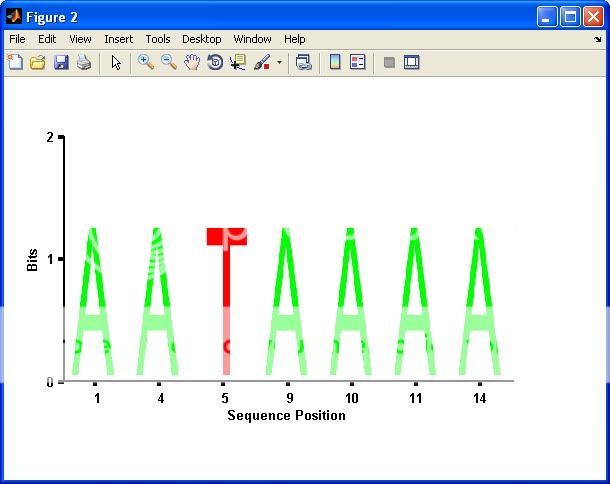
А вот несколько примеров ее использования:
S = ['ATTATAGCAAACTA'; ...  %# Sample data
     'AACATGCCAAAGTA'; ...
     'ATCATGCAAAAGGA'];
seqlogo_new(S);             %# A normal plot similar to SEQLOGO
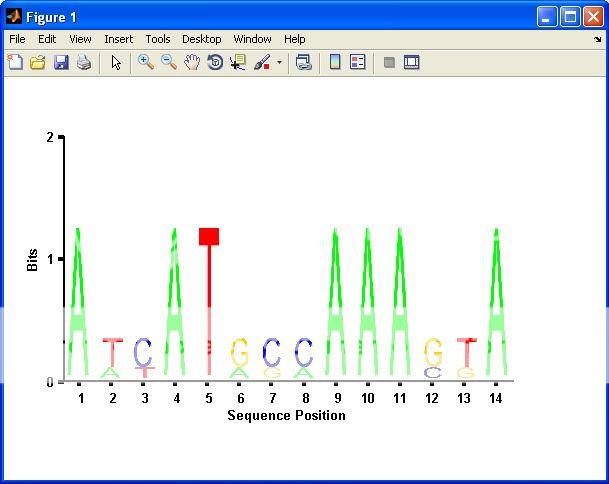
seqlogo_new(S,1); %# Plot only columns with bits > 1
Итак, я создал другое решение, используя части решения yuk и gnovice. Когда я поигрался с решением, я понял, что действительно хотел бы иметь возможность использовать вывод в качестве «подзаголовков» и иметь возможность произвольно изменять цвет букв.
Поскольку yuk использовал программно размещенные объекты осей со встроенной буквой, было бы очень неприятно (хотя и возможно) изменить его код для построения произвольного объекта осей. Поскольку решение gnovice считывает буквы из заранее созданного файла, было бы сложно изменить код для работы с произвольными цветовыми схемами или выбранными буквами. Итак, в моем решении используется код «генерации букв» из решения yuk и метод «наложения изображений» из решения gnovice.
Существует также значительное количество операций синтаксического анализа и проверки аргументов. Ниже мое комбинированное решение ... Я включаю его только для полноты картины, я явно не могу выиграть свою награду. Я позволю сообществу принять решение о награде и дам награду тому, кто имеет наивысший рейтинг в конце срока ...в случае ничьей я отдам его человеку с наименьшим количеством повторений (ему, вероятно, «нужно» больше).
function [npos, handle] = SeqLogoFig(SEQ, varargin)
%   SeqLogoFig
%       A function which wraps around the bioinformatics SeqLogo command
%       and creates a figure which is actually a MATLAB figure.  All
%       agruements for SEQLOGO are passed along to the seqlogo calculation.
%       It also supports extra arguements for plotting.
%
%   [npos, handle] = SeqLogoFig(SEQ);
%
%       SEQ             A multialigned set of sequences that is acceptable
%                       to SEQLOGO.
%       npos            The positions that were actually plotted
%       handle          An axis handle to the object that was plotted.
%
%   Extra Arguements:
%
%       'CUTOFF'        A bit-cutoff to use for deciding which columns to
%                       plot.  Any columns that have a MAX value which is
%                       greater than CUTOFF will be provided.  Defaults to
%                       1.25 for NT and 2.25 for AA.
%
%       'TOP-N'         Plots only the top N columns as ranked by thier MAX
%                       bit conservation.
%
%       'AXES_HANDLE'   An axis handle to plot the seqlogo into.
%
%       'INDS'          A set of indices to to plot.  This overrides any
%                       CUTOFF or TOP-N that were provided
%
%
%
%

%% Parse the input arguements
ALPHA = 'nt';
MAX_BITS = 2.5;
RES = [200 80];
CUTOFF = [];
TOPN = [];
rm_inds = [];
colors = [];
handle = [];
npos = [];


for i = 1:2:length(varargin)
    if strcmpi(varargin{i}, 'alphabet')
        ALPHA = varargin{i+1};

    elseif strcmpi(varargin{i}, 'cutoff')
        CUTOFF = varargin{i+1};
        %we need to remove these so seqlogo doesn't get confused
        rm_inds = [rm_inds i, i+1]; %#ok<*AGROW>

    elseif strcmpi(varargin{i}, 'colors')
        colors = varargin{i+1};
        rm_inds = [rm_inds i, i+1];
    elseif strcmpi(varargin{i}, 'axes_handle')
        handle = varargin{i+1};
        rm_inds = [rm_inds i, i+1];
    elseif strcmpi(varargin{i}, 'top-n')
        TOPN = varargin{i+1};
        rm_inds = [rm_inds i, i+1];
    elseif strcmpi(varargin{i}, 'inds')
        npos = varargin{i+1};
        rm_inds = [rm_inds i, i+1];
    end
end

if ~isempty(rm_inds)
    varargin(rm_inds) = [];
end

if isempty(colors)
    colors = GetColors(ALPHA);
end

if strcmpi(ALPHA, 'nt')
    MAX_BITS = 2.5;
elseif strcmpi(ALPHA, 'aa')
    MAX_BITS = 4.5;
end

if isempty(CUTOFF)
    CUTOFF = 0.5*MAX_BITS;
end


%% Calculate the actual seqlogo.
wm = seqlogo(SEQ, varargin{:}, 'displaylogo', false);


%% Generate the letters
letters = wm{1};
letter_wins = cell(size(letters));
[~, loc] = ismember(letters, colors(:,1));
loc(loc == 0) = size(colors,1);
clr = cell2mat(colors(loc, 2)); % corresponding colors
for t = 1:numel(letters)
    hf = figure('position',[200 200 100 110],'color','w');
    ha = axes('parent',hf, 'visible','off','position',[0 0 1 1]);
    ht = text(50,55,letters(t),'color',clr(t,:),'units','pixels',...
        'fontsize',100,'fontweight','norm',...
        'vertical','mid','horizontal','center');
    F = getframe(hf); % rasterize the letter
    img = F.cdata;
    m = any(img < 255,3); % convert to binary image
    m(any(m,2),any(m,1))=1; % mask to cut white borders
    letter_wins{t} = reshape(img(repmat(m,[1 1 3])),[sum(any(m,2)) sum(any(m,1)) 3]);
    close(hf);
end


%% Use the letters to generate a figure

%create a "image" that will hold the final data
wmat = wm{2};
if isempty(npos)
    if isempty(TOPN)
        npos = find(any(wmat>CUTOFF,1));
    else
        [~, i] = sort(max(wmat,[],1), 'descend');
        npos = sort(i(1:TOPN));
    end
end

fig_data = 255*ones(RES(1), RES(2)*(length(npos)+1)+length(npos)*2,3);
bitscores = linspace(0, MAX_BITS, size(fig_data,1));
tick_pos = zeros(length(npos),1);
% place images of letters
for i=1:length(npos)
    [wms idx] = sort(wmat(:,npos(i)), 'descend'); % largest on the top
    bits = [flipud(cumsum(flipud(wms))); 0];
    let_data = letter_wins(idx(wms>0));
    for s=1:length(let_data)
        start_pos = find(bitscores>=bits(s),1);
        end_pos = find(bitscores<=bits(s+1),1, 'last');
        if isempty(start_pos) || isempty(end_pos) || end_pos > start_pos
            continue
        end
        img_win = imresize(let_data{s}, [start_pos-end_pos, RES(2)]);

        fig_data(start_pos-1:-1:end_pos, (i*RES(2)-RES(2)*.5:i*RES(2)+RES(2)*.5-1)+2*i,:) = img_win;
    end
    tick_pos(i) = i*RES(2)+2*i;
end
if ~isempty(handle)
    image(handle,[0 size(fig_data,2)], [0 MAX_BITS],fig_data./255)
else
    handle = image([0 size(fig_data,2)], [0 MAX_BITS],fig_data./255);
end
set(gca, 'ydir', 'normal', 'xtick', tick_pos, ...
        'userdata', tick_pos, 'xticklabel', npos);
xlabel('position')
ylabel('bits')


function colors = GetColors(alpha)
% get the standard colors for the sequence logo
if strcmpi(alpha, 'nt')
    colors = cell(6,2);
    colors(1,:) = {'A', [0 1 0]};
    colors(2,:) = {'C', [0 0 1]};
    colors(3,:) = {'G', [1 1 0]};
    colors(4,:) = {'T', [1 0 0]};
    colors(5,:) = {'U', [1 0 0]};
    colors(6,:) = {'', [1 0 1]};
elseif strcmpi(alpha, 'aa')
    colors = cell(21,2);
    colors(1,:) = {'G', [0 1 0]};
    colors(2,:) = {'S', [0 1 0]};
    colors(3,:) = {'T', [0 1 0]};
    colors(4,:) = {'Y', [0 1 0]};
    colors(5,:) = {'C', [0 1 0]};
    colors(6,:) = {'Q', [0 1 0]};
    colors(7,:) = {'N', [0 1 0]};
    colors(8,:) = {'A', [1 165/255 0]};
    colors(9,:) = {'V', [1 165/255 0]};
    colors(10,:) = {'L', [1 165/255 0]};
    colors(11,:) = {'I', [1 165/255 0]};
    colors(12,:) = {'P', [1 165/255 0]};
    colors(13,:) = {'W', [1 165/255 0]};
    colors(14,:) = {'F', [1 165/255 0]};
    colors(15,:) = {'M', [1 165/255 0]};
    colors(16,:) = {'D', [1 0 0]};
    colors(17,:) = {'E', [1 0 0]};
    colors(18,:) = {'K', [0 0 1]};
    colors(19,:) = {'R', [0 0 1]};
    colors(20,:) = {'H', [0 0 1]};
    colors(21,:) = {'', [210/255 180/255 140/255]};
else
    error('SeqLogoFigure:BADALPHA', ...
            'An unknown alphabet was provided: %s', alpha)
end
Я отправил это в Mathworks FileExchange ... когда он будет одобрен, я отправлю ссылку.
Единственное, что меня раздражает, это то, что при создании буквенных изображений он с большой скоростью отображает маленькие окошки с фигурками. Если кто-нибудь знает трюк, которого можно избежать, я бы хотел его услышать.
РЕДАКТИРОВАТЬ: Mathworks одобрил мой представленный файл ... вы можете скачать его на FileExchange здесь: http://www.mathworks.com/matlabcentral/fileexchange/27124